Markets Snapshot:
NASDAQ BP:25.19 and is in a column of Xs on a SELL signal
NYSE BP:30.28 and is in a column of Xs on a SELL signal
Created Boxes: X - 134 O - 216
New Signals: Buy - 25 Sell - 28
New Reversals: Up - 201 Down - 131
Broke Double: Tops - 25 Bottoms - 41
Sector Performance Yesterday
S&P Equal Weight: -0.57%
Bottom Sectors:
Real Estate: -2.20%
Gaming: -1.76%
Wall Street: -1.61%
Top Sectors:
Precious Metals: 2.44%
Oil: 1.89%
Steel and Iron: 1.15%
New Signals
No new Exchange signals
No new Sector signals
Stock Signals:
Buy Signals:
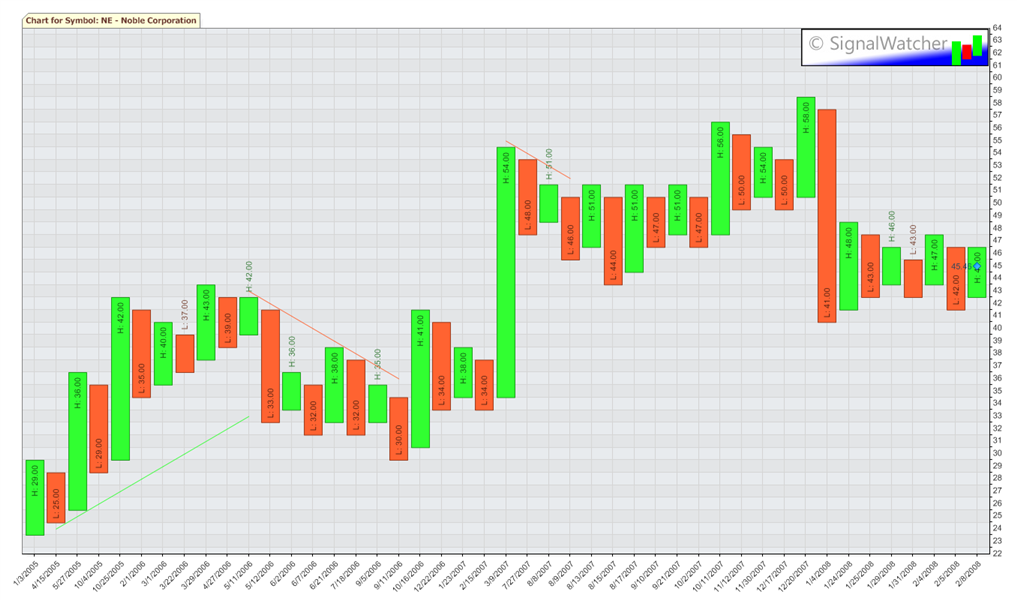
Bear Trap Buy Signal: NE
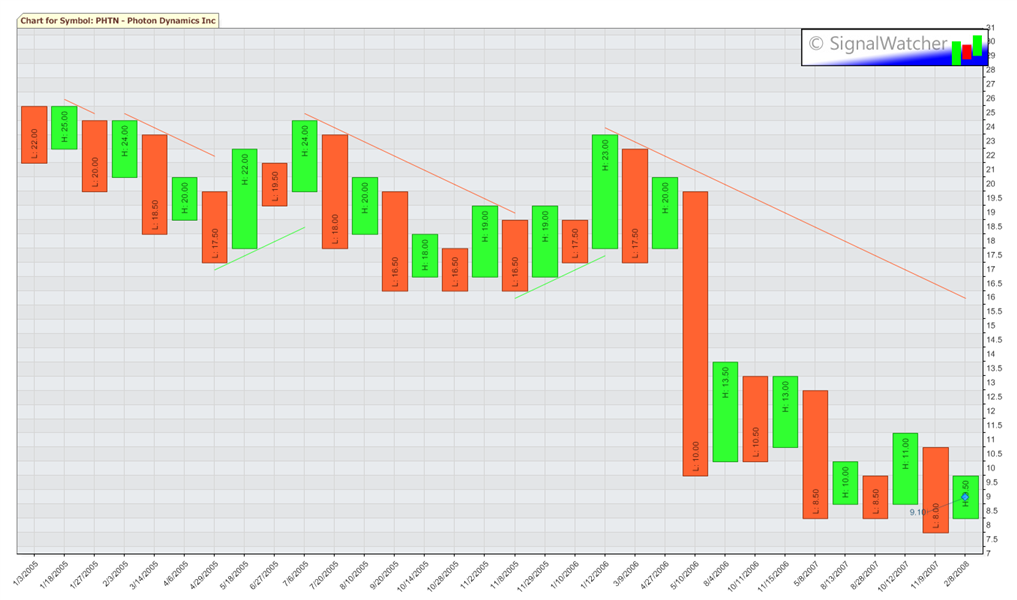
Bear Trap Buy Signal: PHTN
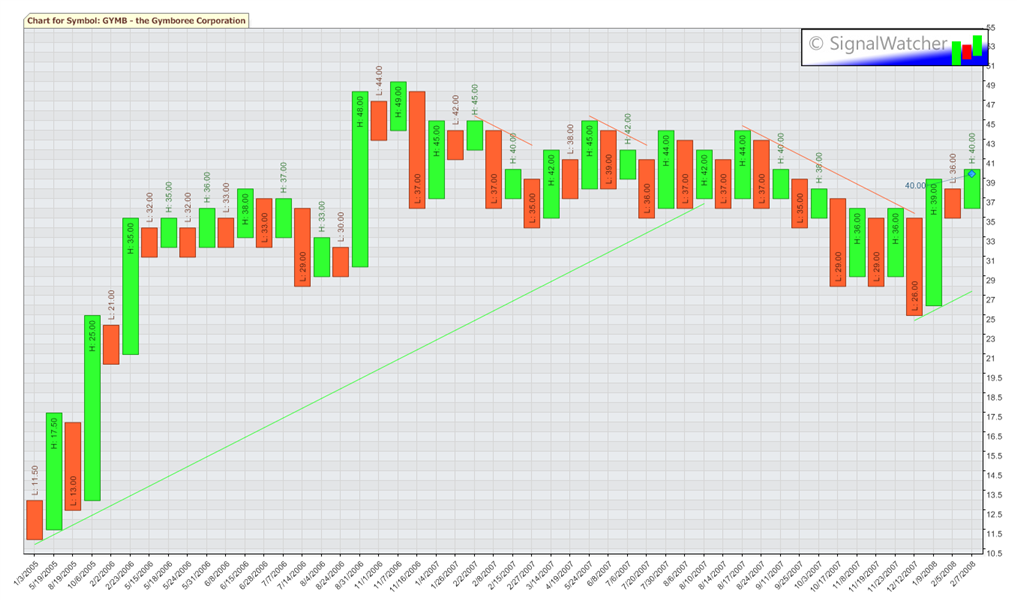
Bullish Catapult Signal: GYMB
Sell Signals:
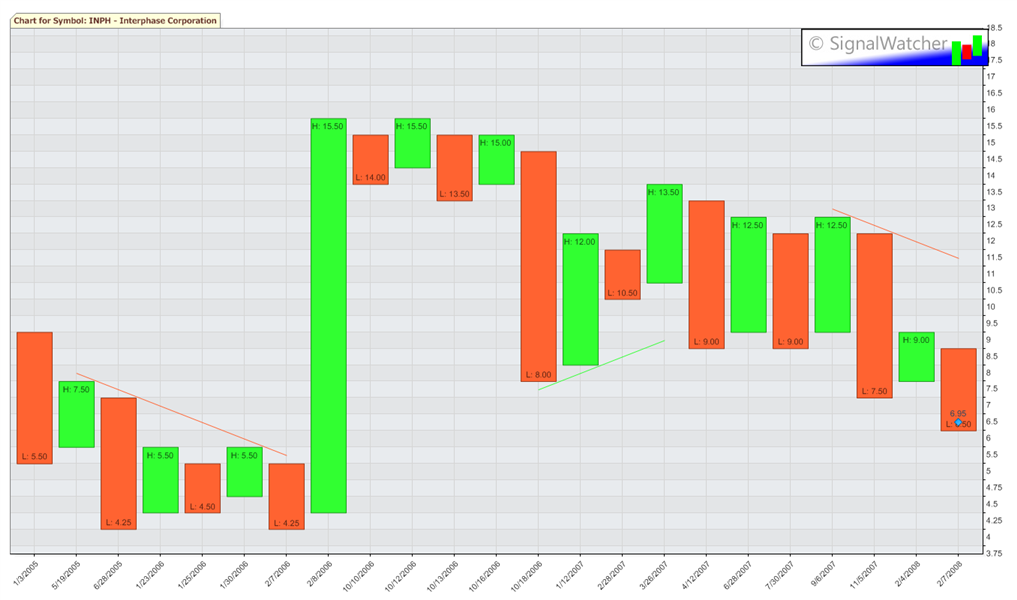
Bearish Catapult Signal: INPH
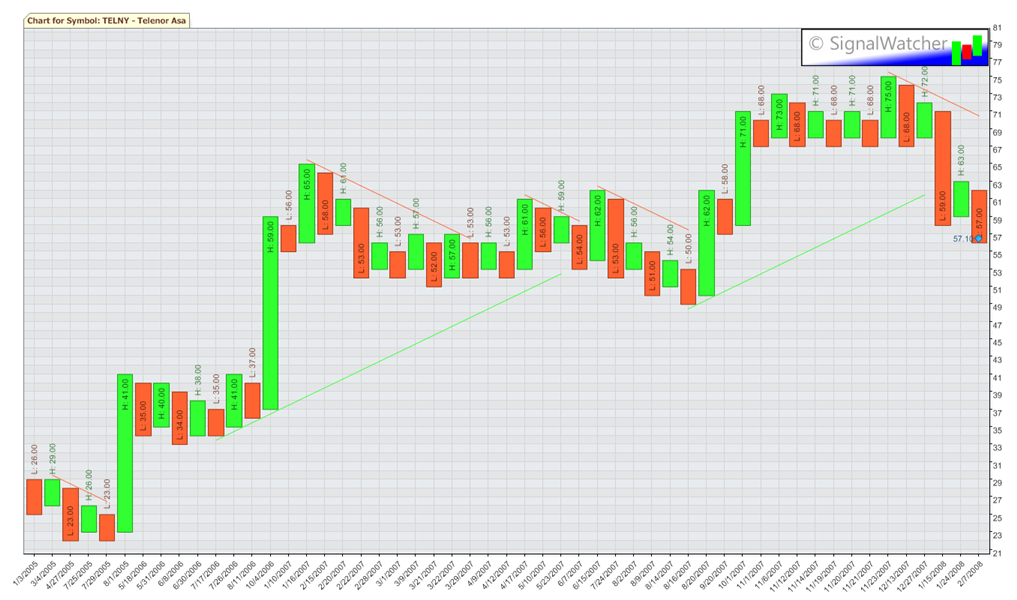
Bearish Catapult Signal: TELNY
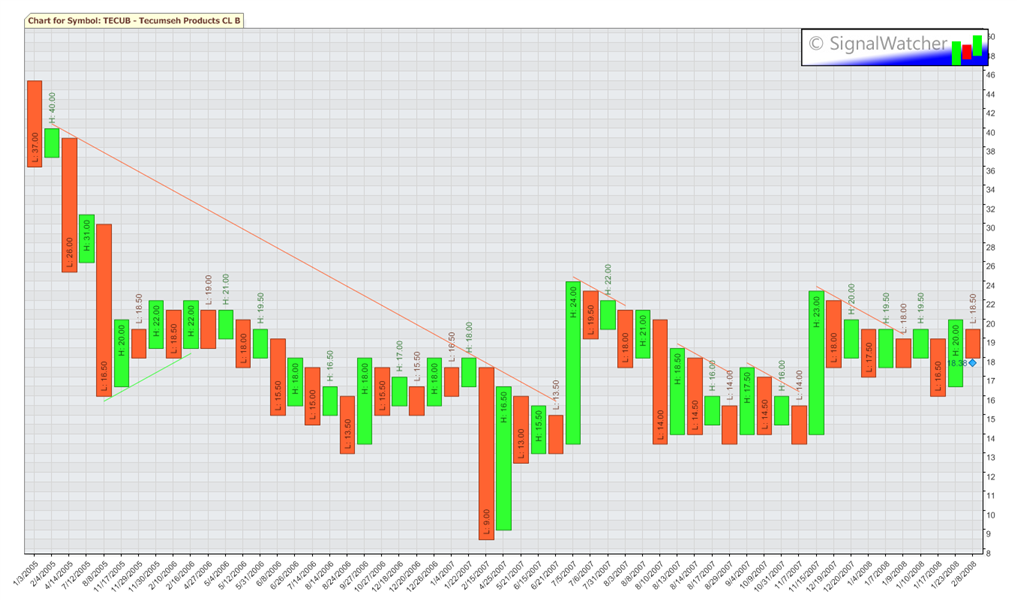
Bull Trap Sell Signal: TECUB
Saturday, February 9, 2008
Market Summary for February 08, 2008
Thursday, February 7, 2008
Market Summary for 2/7/2008
Markets Snapshot:
NASDAQ BP:25.22 and is in a column of Xs on a SELL signal
NYSE BP:30.53 and is in a column of Xs on a SELL signal
Created Boxes: X - 124 O - 529
New Signals: Buy - 22 Sell - 60
New Reversals: Up - 118 Down - 286
Broke Double: Tops - 19 Bottoms - 105
Some support was found after a several down days, although it almost evaporated near the close. The majority of signals was still negative, but look for it to improve tomorrow as the stocks continue their bounce off of this low.
Sector Performance Yesterday
S&P Equal Weight: 1.02%
Bottom Sectors:
Media: -1.32%
Utilities - Electrical: -0.37%
Drugs: -0.17%
Top Sectors:
Wall Street: 3.66%
Gaming: 3.18%
Retailing: 3.17%
New Signals
No new Exchange signals
Sector Signals:
Sector Buy Signal: Textiles and Apparel 
Stock Signals:
Buy Signals:
Bear Trap Buy Signal: CRM 
Bear Trap Buy Signal: SKY
Bear Trap Buy Signal: UTMD 
Sell Signals:
Bearish Catapult Signal: ADSK 
Bearish Catapult Signal: DBSDY
Bearish Catapult Signal: EMC 
Bearish Catapult Signal: PGSVY
Bull Trap Sell Signal: CT 
Bull Trap Sell Signal: HVT
Bull Trap Sell Signal: OMTR
Bull Trap Sell Signal: WINN
Wednesday, February 6, 2008
Market Summary for 2/6/2008
Markets Snapshot:
NASDAQ BP:25.71 and is in a column of Xs on a SELL signal
NYSE BP:31.62 and is in a column of Xs on a SELL signal
Created Boxes: X - 104 O - 433
New Signals: Buy - 28 Sell - 60
New Reversals: Up - 77 Down - 286
Broke Double: Tops - 26 Bottoms - 91
The Broke Double Bottoms count has been off for the last few days as I realized that I was trying to compare a column value to a box number.
Sector Performance
S&P Equal Weight: -0.73%
Bottom Sectors:
Wall Street: -5.87%
Computers: -3.62%
Internet: -3.03%
Top Sectors:
Precious Metals: 1.33%
Waste Management: -0.02%
Utilities - Electrical: -0.07%
New Signals
Sector Signals:
No new signals
Stock Signals:
Buy Signals:
Bear Trap Buy Signal: AHG
Bear Trap Buy Signal: RAH
Sell Signals:
Bearish Catapult Signal: CMG
Bearish Catapult Signal: FCS
Bearish Catapult Signal: FSP
Bearish Catapult Signal: TOD
Bearish Catapult Signal: TWC
Bull Trap Sell Signal: CHFC
Bull Trap Sell Signal: UMPQ
The System
Where are my signals coming from? Why is my system different than charts offered at any place like Yahoo, BigCharts.com, StockCharts.com?
Well, it started with my desire to learn about Point and Figure. For me the best way to learn something is to do it myself - not just believe what everyone else writes.
A little about me... I am a software engineer by trade and enjoy just about everything to do with computers. I think in code and numbers all the time, sometimes to the frustration of others around me... I have worked in a number of environments that have included enterprise reporting and statistical number crunching.
When I started getting into P&F, I thought to myself - I could do this and make a cool little application that can create a chart for any stock that I wanted - that will help me learn what all these signals mean. At this point, I probably have about 1,000 hours invested in the development of my "little" application and don't plan to stop improving it anytime soon.
What can it do, you ask? While I can chart any stock that I hear about in the news, it's not the only thing that it can do. Every night, I download daily stock quotes from freely available data sources on the net. Then I sort through stocks that have been merged or have delisted to remove them (usually a couple a week). I then run my update process (think big reporting job) to calculate any changes in the stocks and their columns, which also sums up exchange and sector data. Once that is done, I run my historical reports, which searches for new signals in stocks, sectors and exchanges. I review the results and share them here on the net.
Why? Because through this exercise I will learn more as I share my insights with you and hopefully we'll all gain a better perspective for our investing.
Market Summary for 2/5/2008
Markets Snapshot:
NASDAQ BP:26.08 and is in a column of Xs on a SELL signal
NYSE BP:32.98 and is in a column of Xs on a SELL signal
Created Boxes: X - 92 O - 217
New Signals: Buy - 9 Sell - 50
New Reversals: Up - 84 Down - 537
Broke Double: Tops - 9 Bottoms - 0
Just a big down day yesterday. 10% of the stocks in my system reversed down. All sectors were down except for a small gain in gaming. I introduced the bear trap and bull trap signals to my system yesterday and they generated a bunch of signals today.
The signals that I track are: broke triple tops, broke triple bottoms, bullish catapults, bearish catapults, breaking 90, bear traps, bull traps, sector buy, sector sell, exchange buy, and exchange sell signals. With all of these signals being tracked there is usually a few ideas each day and I provide the signal along with the chart from my system.
Sector Performance Yesterday
S&P Equal Weight: -3.22%
Bottom Sectors:
Precious Metals: -5.14%
Wall Street: -5.09%
Semiconductors: -5.06%
Top Sectors:
Gaming: 0.42%
Savings and Loans: -1.58%
Healthcare: -1.68%
New Signals
Sector Signals:
None
Stock Signals:
Buy Signals:
Bear Trap Buy Signal: EUM
Sell Signals:
Bearish Catapult Signal: TRBN 
Bull Trap Sell Signal: BARI 
Bull Trap Sell Signal: EFUT
Bull Trap Sell Signal: FDO 
Bull Trap Sell Signal: GME
Bull Trap Sell Signal: PFG
Bull Trap Sell Signal: PLFE
Bull Trap Sell Signal: RYL 
Bull Trap Sell Signal: SINA
Bull Trap Sell Signal: WW 
Tuesday, February 5, 2008
Market Summary for 2/4/2008
Markets Snapshot:
NASDAQ BP: 26.75 and is in a column of Xs on a SELL signal
NYSE BP: 34.19 and is in a column of Xs on a SELL signal
Created Boxes: X - 468 O - 60
New Signals: Buy - 69 Sell - 9
New Reversals: Up - 166 Down - 135
Broke Double: Tops - 31 Bottoms - 0
Sector Performance Yesterday
S&P Equal Weight: -1.25%
Bottom Sectors:
Gaming: -2.84%
Textiles and Apparel: -2.40%
Retailing: -2.39%
Restaurants: -2.34%
Top Sectors:
Utilities - Electrical: 1.42%
Utilities - Gas: 0.98%
Oil: 0.87%
Oil Service: 0.64%
New Signals
Sector Signals:
Sector Buy Signal: Finance
Stock Signals:
Broke Triple Top: EFUT
Bear Trap Buy Signal: IWA 
Bear Trap Buy Signal: SRP 
Bearish Catapult Signal: WMCO 
Bull Trap Sell Signal: BSC
Bull Trap Sell Signal: GFIG 
Bull Trap Sell Signal: UHAL 
