Markets Snapshot:
NASDAQ BP: 38.58 and is in a column of Xs on a BUY signal
NYSE BP: 39.67 and is in a column of Os on a SELL signal
Created Boxes: X - 210 O - 647
New Signals: Buy - 31 Sell - 67
New Reversals: Up - 136 Down - 436
Broke Double: Tops - 52 Bottoms - 107
New: Highs - 20 Lows - 270
Sector Performance
S&P Equal Weight: -3.69%
Bottom Sectors:
Precious Metals: -9.07%
Steel and Iron: -7.78%
Oil: -7.69%
Top Sectors:
Household Goods: -0.98%
Textiles and Apparel: -1.04%
Healthcare: -1.18%
New Signals
No new Exchange signals
Sector Signals:
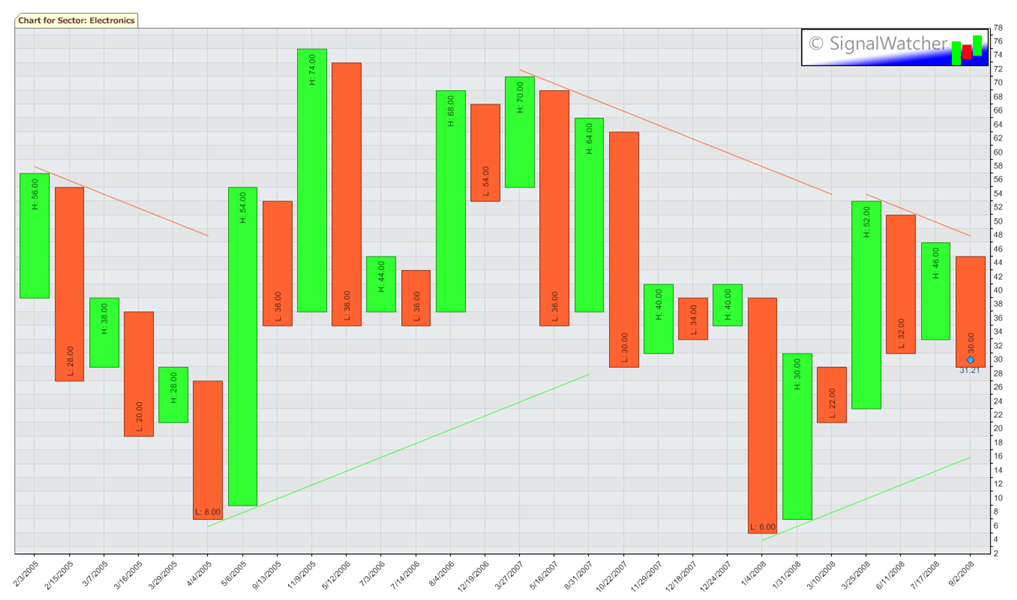
Sector Sell Signal: Electronics
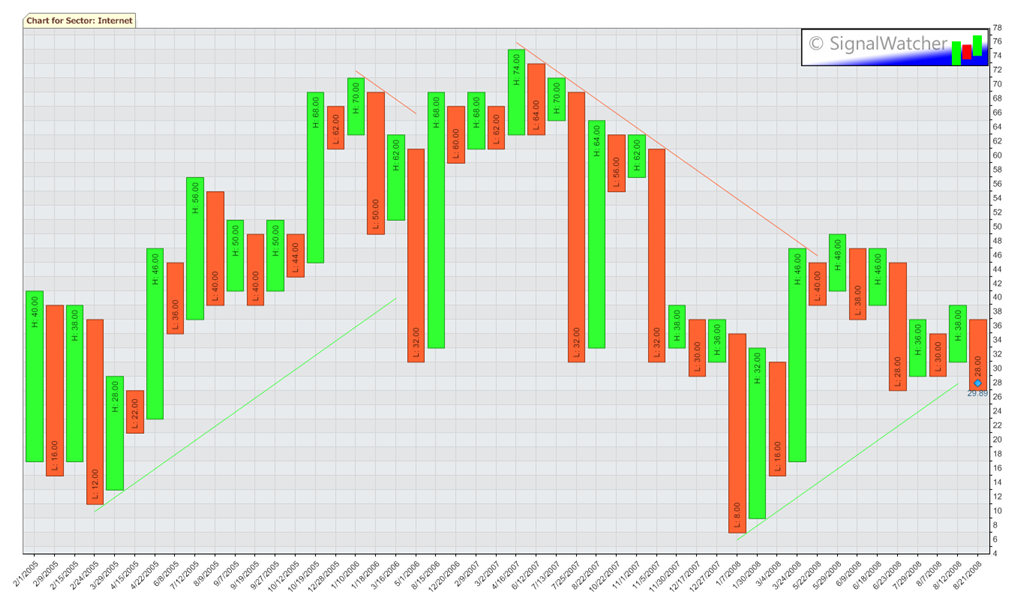
Sector Sell Signal: Internet
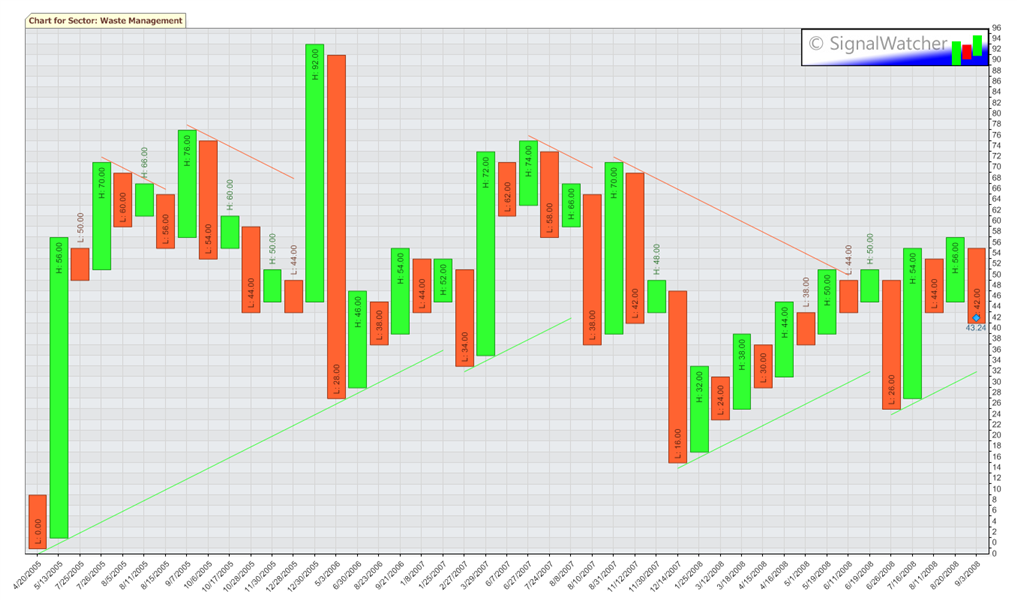
Sector Sell Signal: Waste Management
Stock Signals:
Buy Signals:
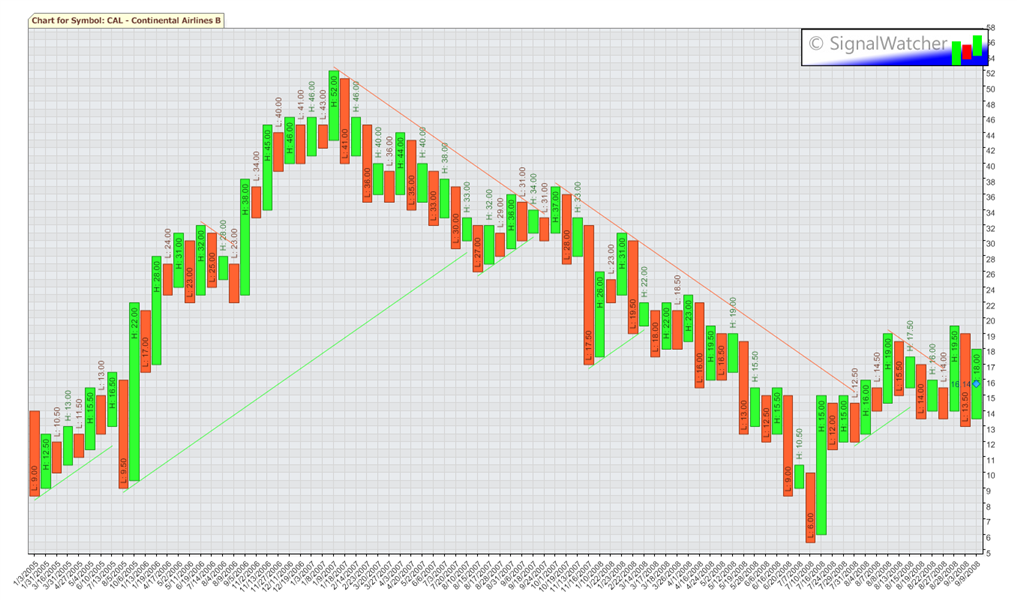
Bear Trap Buy Signal: CAL - Continental Airlines B
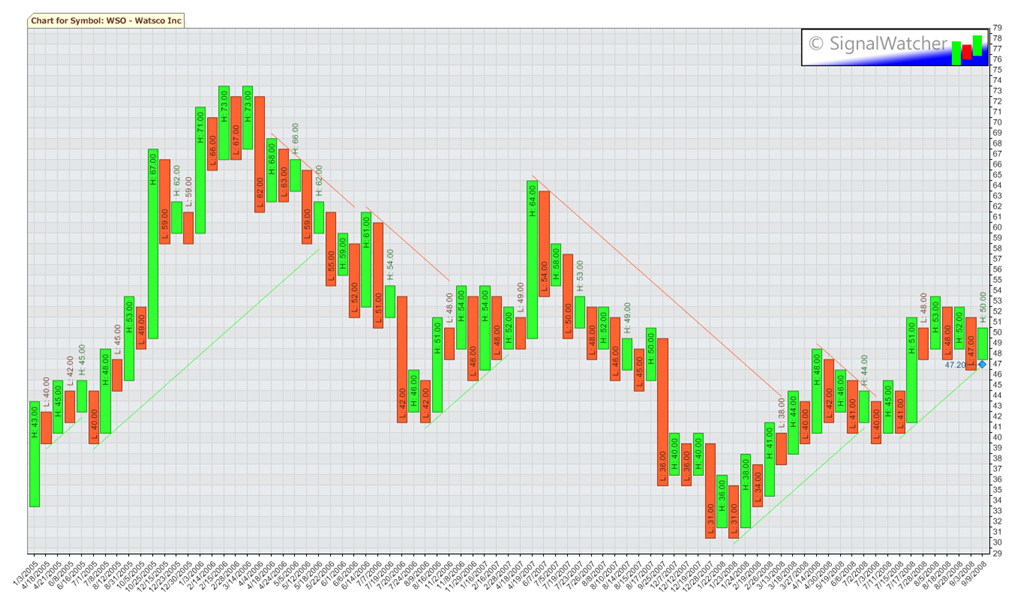
Bear Trap Buy Signal: WSO - Watsco Inc
Sell Signals:
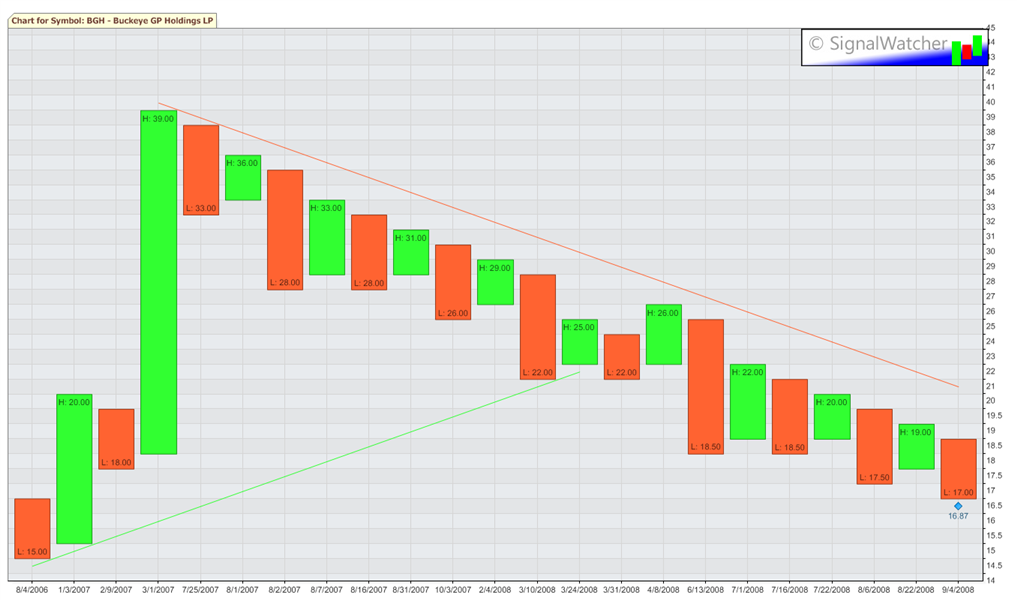
Bearish Catapult Signal: BGH - Buckeye GP Holdings LP
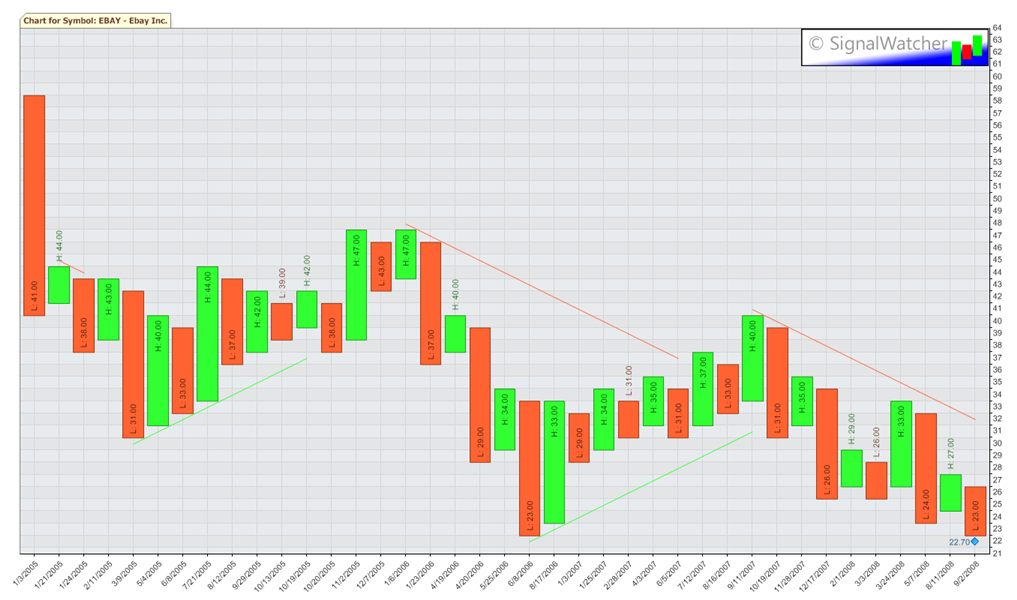
Bearish Catapult Signal: EBAY - Ebay Inc.
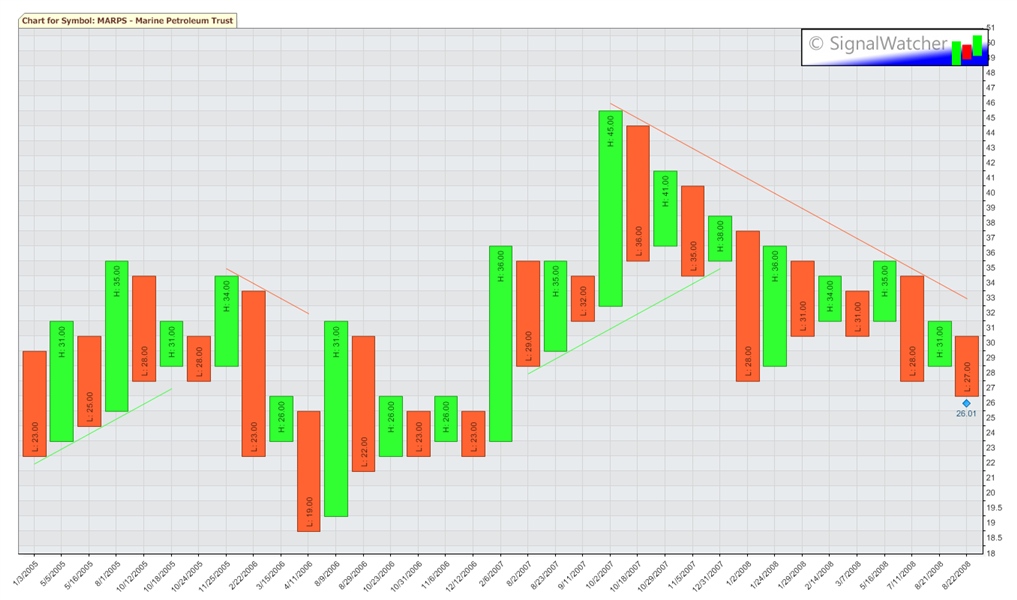
Bearish Catapult Signal: MARPS - Marine Petroleum Trust
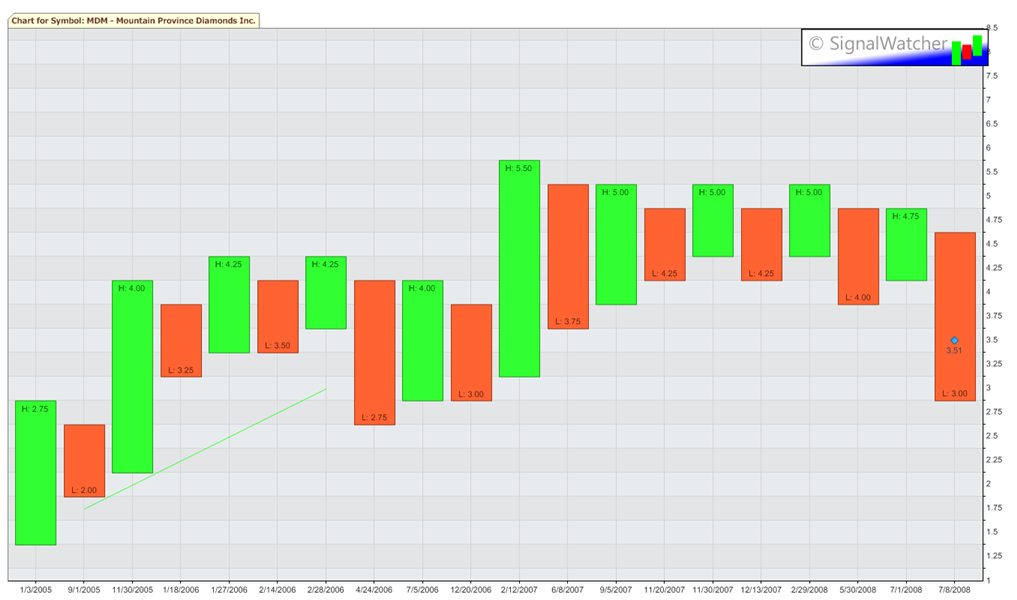
Bearish Catapult Signal: MDM - Mountain Province Diamonds Inc.
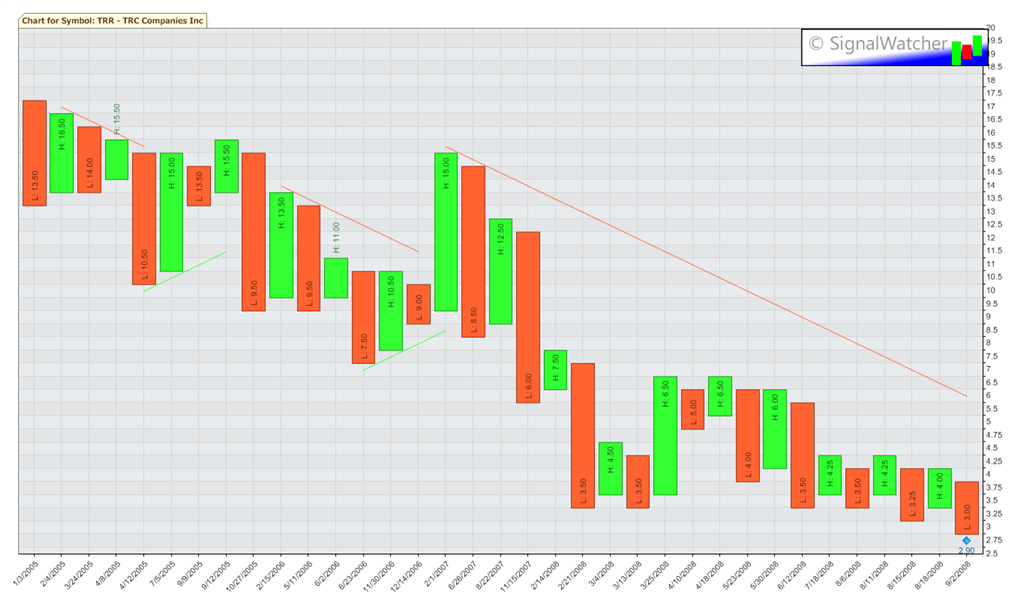
Bearish Catapult Signal: TRR - TRC Companies Inc
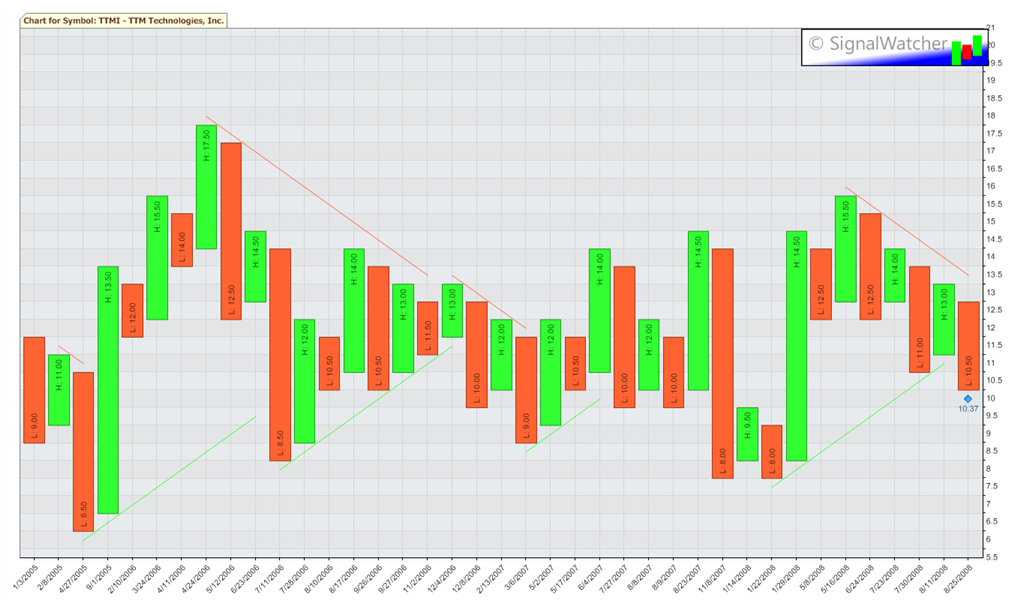
Bearish Catapult Signal: TTMI - TTM Technologies, Inc.
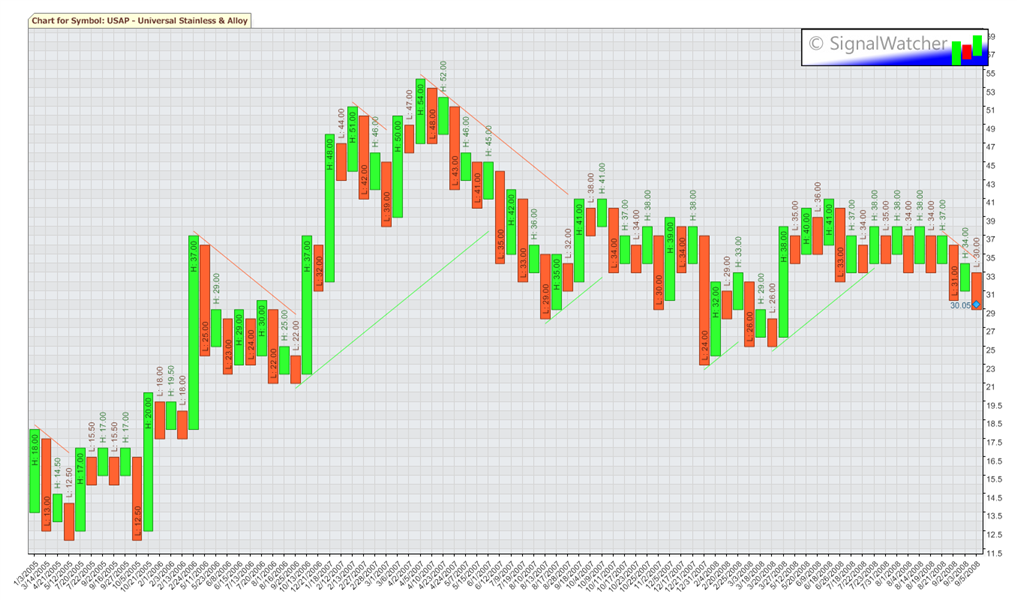
Bearish Catapult Signal: USAP - Universal Stainless & Alloy
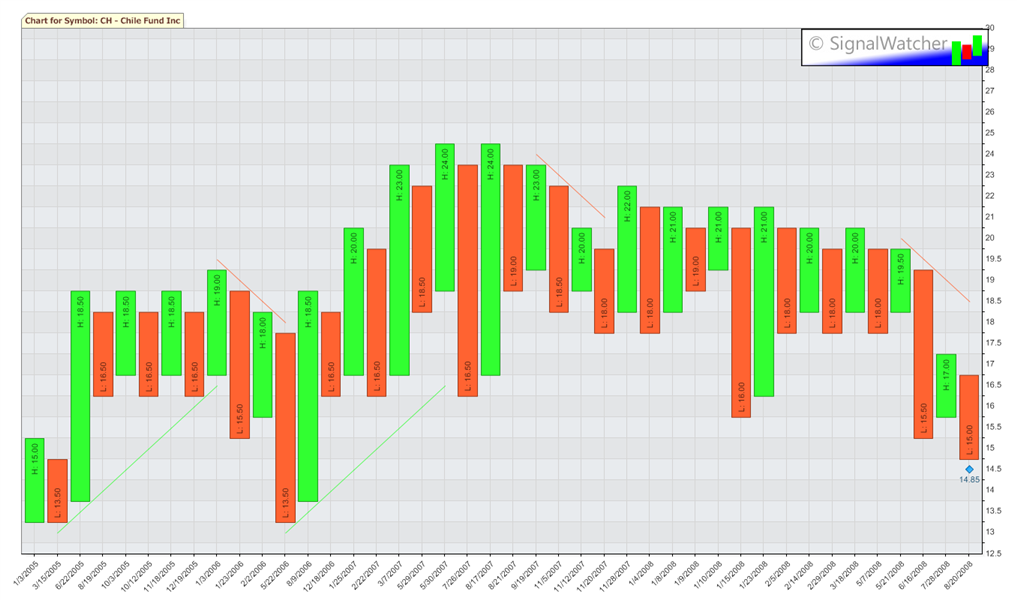
Bearish Catapult Signal: CH - Chile Fund Inc
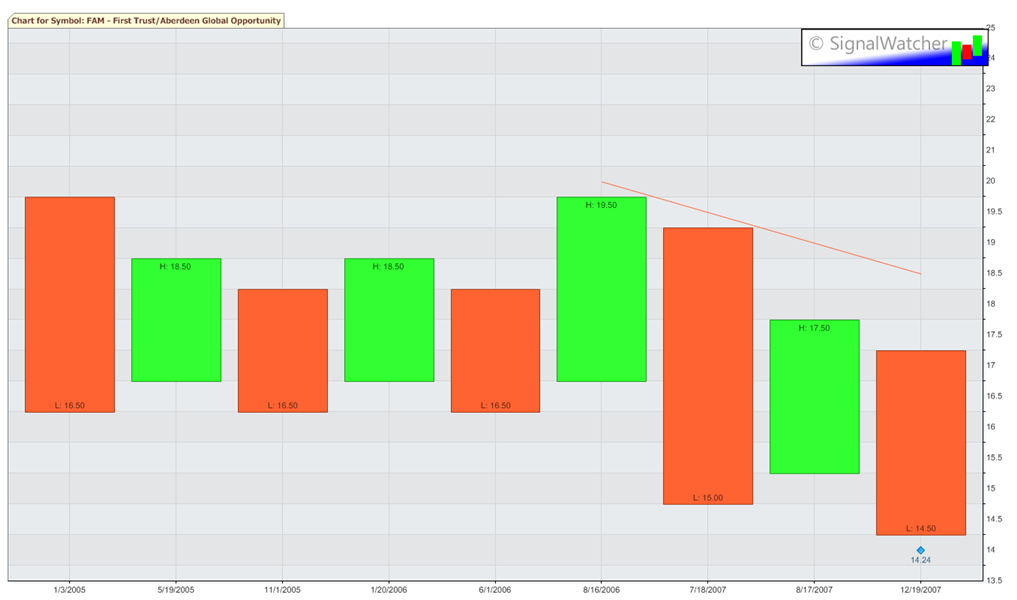
Bearish Catapult Signal: FAM - First Trust/Aberdeen Global Opportunity
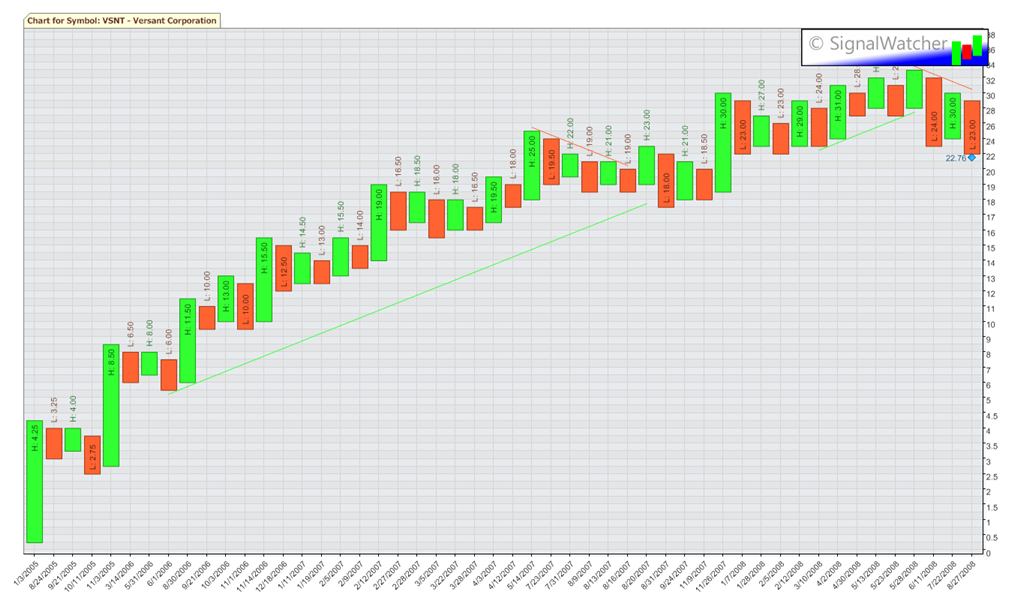
Bearish Catapult Signal: VSNT - Versant Corporation
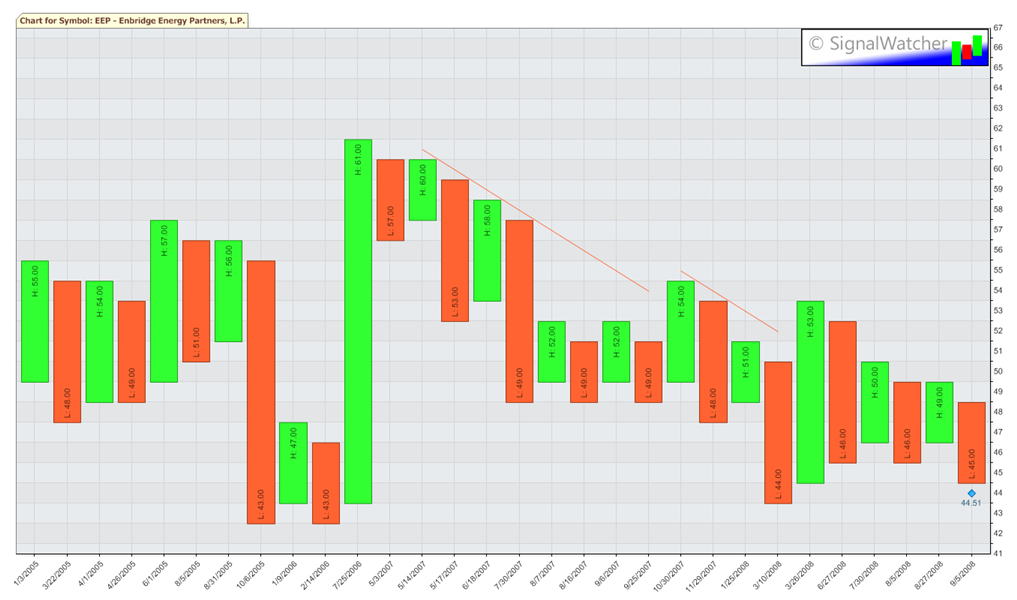
Broke Triple Bottom: EEP - Enbridge Energy Partners, L.P.
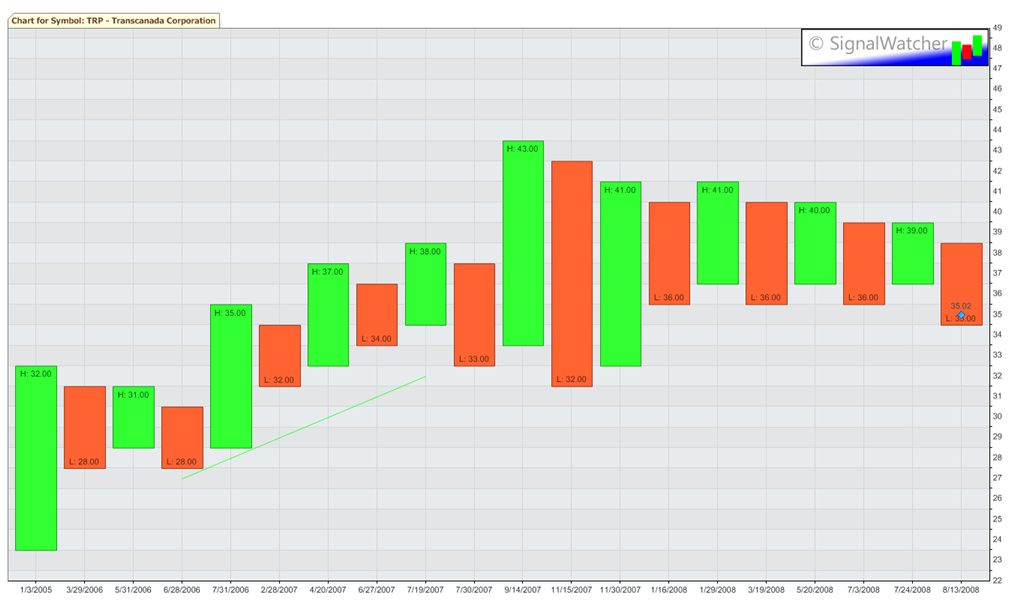
Broke Triple Bottom: TRP - Transcanada Corporation
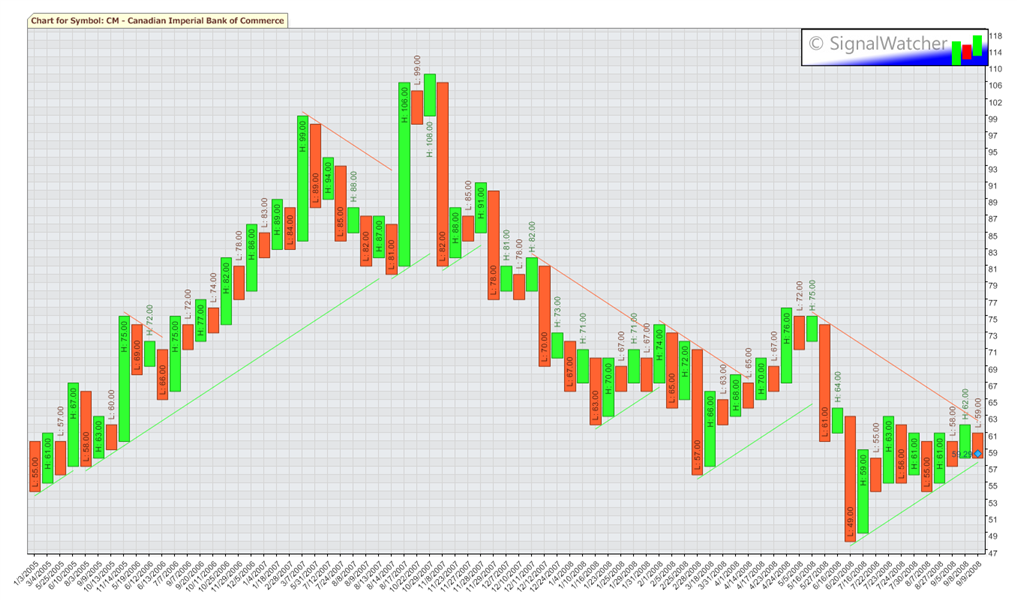
Bull Trap Sell Signal: CM - Canadian Imperial Bank of Commerce
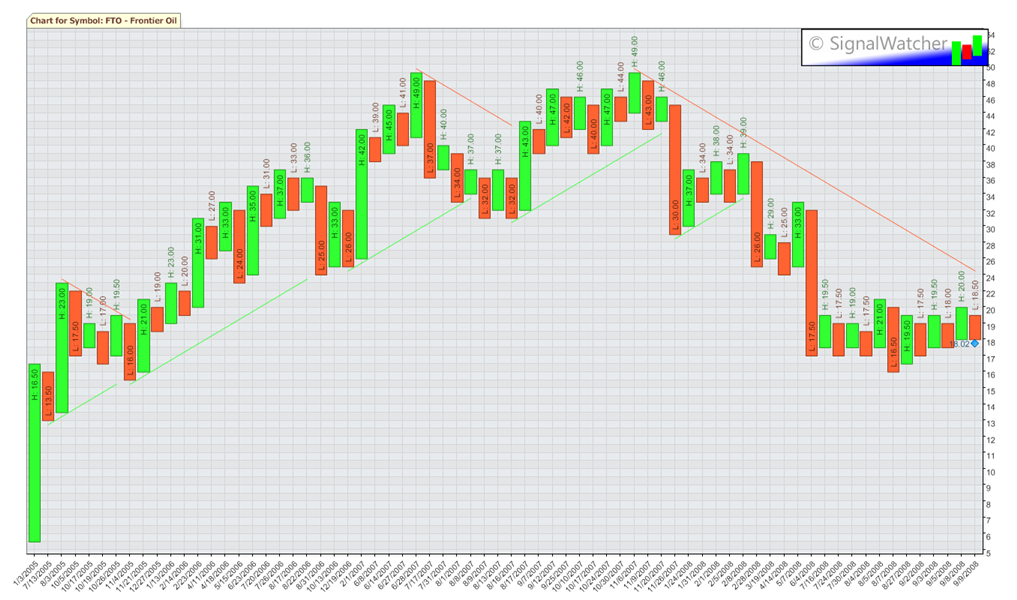
Bull Trap Sell Signal: FTO - Frontier Oil
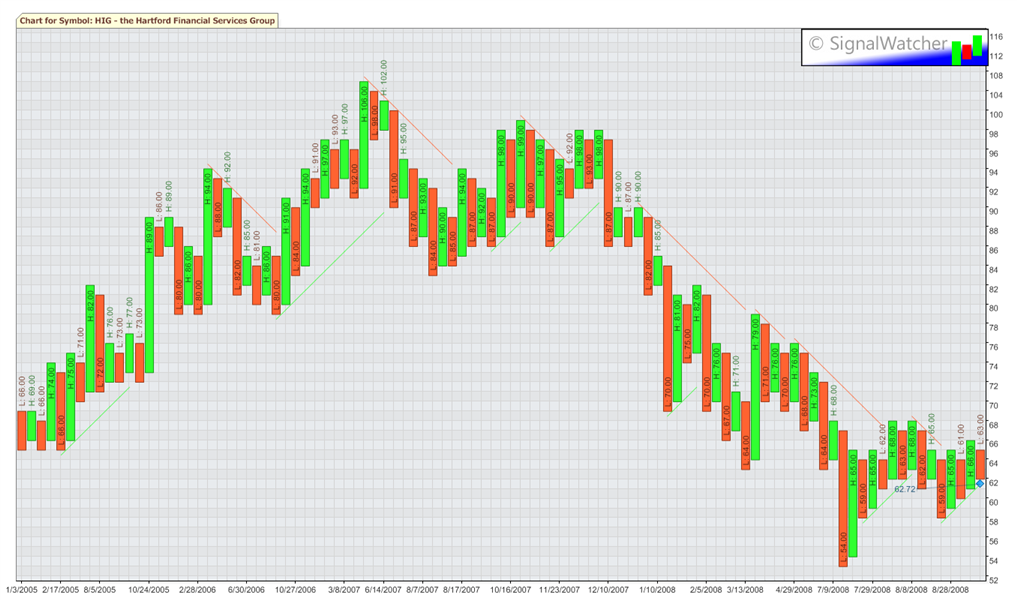
Bull Trap Sell Signal: HIG - the Hartford Financial Services Group
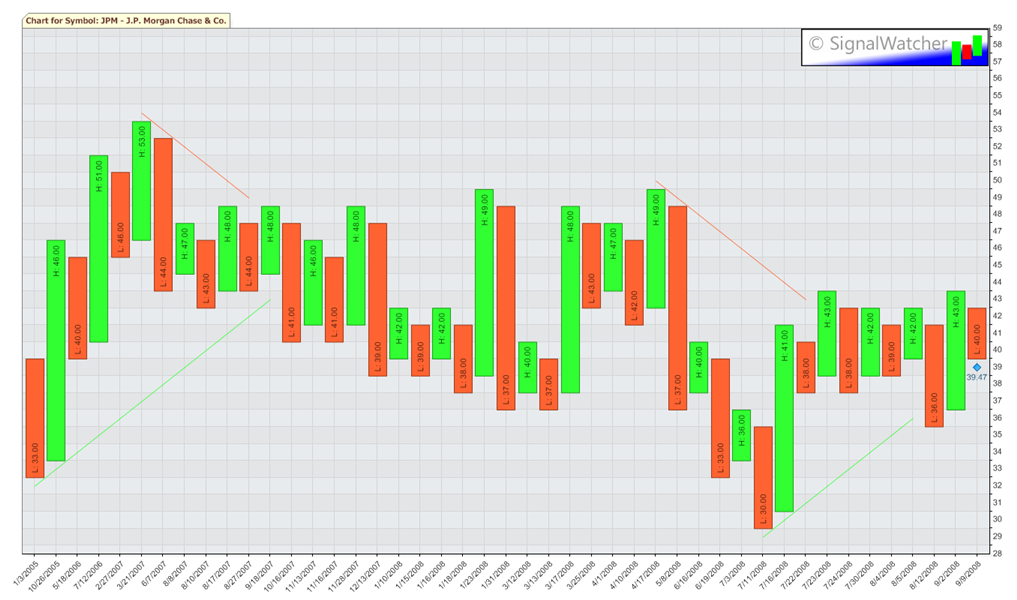
Bull Trap Sell Signal: JPM - J.P. Morgan Chase & Co.
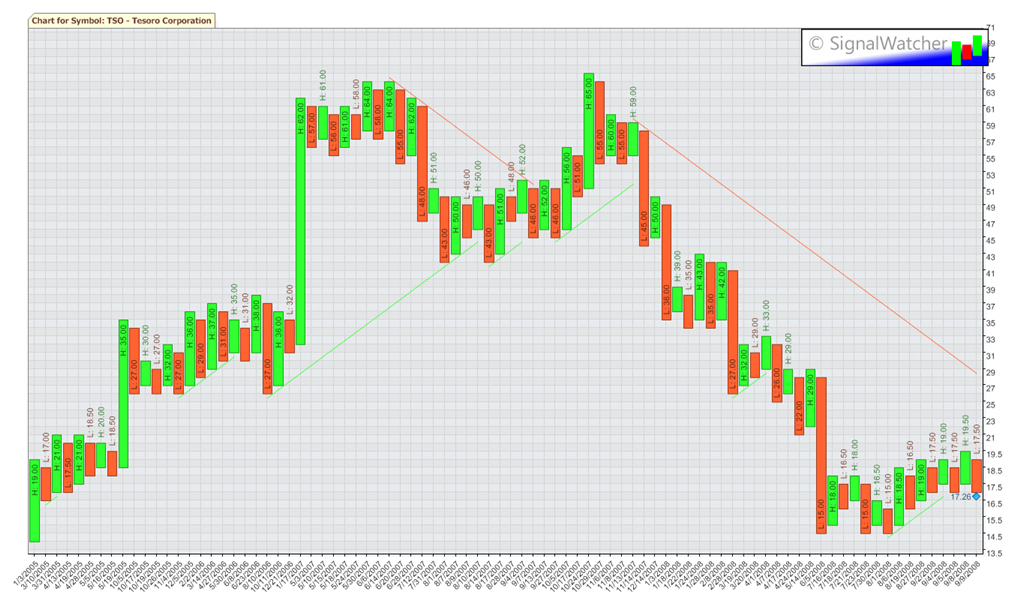
Bull Trap Sell Signal: TSO - Tesoro Corporation
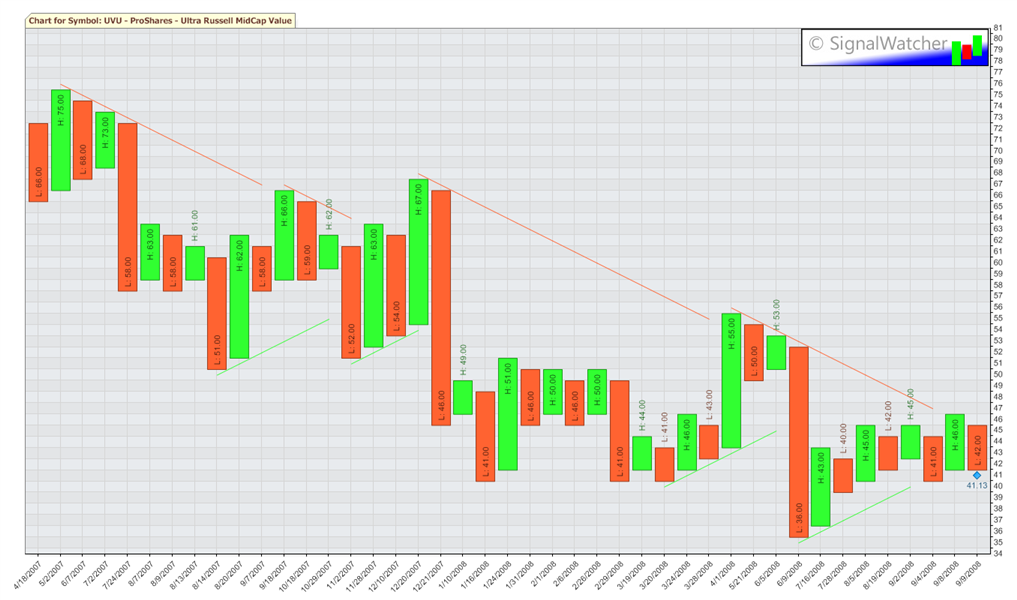
Bull Trap Sell Signal: UVU - ProShares - Ultra Russell MidCap Value
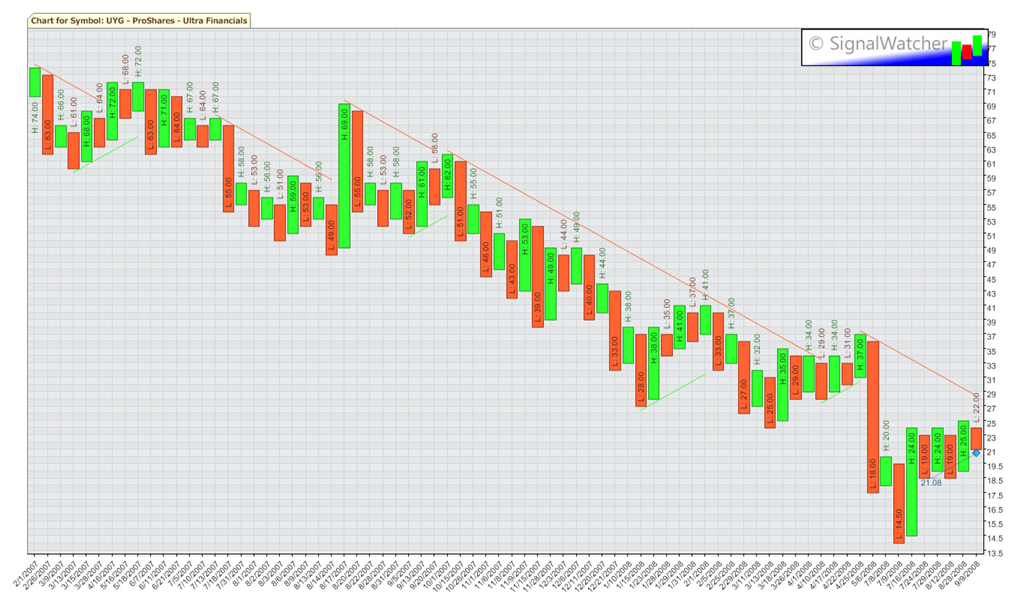
Bull Trap Sell Signal: UYG - ProShares - Ultra Financials
Wednesday, September 10, 2008
Market Summary for September 09, 2008
![]()
Subscribe to:
Post Comments (Atom)

2 comments:
a question.....
You have some statistics posted...... are these all prepared by your spreadsheet also.....?
and another question.... how much data are you using to plot the charts?
Thanks
dave
Thanks for the post Dave.
Yes, the statistics are all derived from data generated by my software system. All charts on this site are created using end of day data for the time period from 1/3/2005 until the present.
Post a Comment